Page 1 of 1
Homework 8, due November 27, 2007.
Posted: Tue Nov 20, 2007 12:08 am
by goodwine
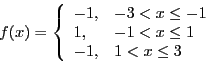
- Compute the Fourier series for
where
Plot f(x) and the first several terms of the series on the same graph.
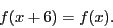
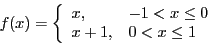
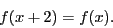
- Compute the Fourier series for
where
Plot f(x) and the first several terms of the series on the same graph.
- Determine the solution to
where
and
Plot the solution for t=0 and several other times to clearly demonstrate the nature of the solution.
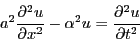
- Determine the solution to
where
and
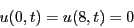
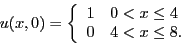
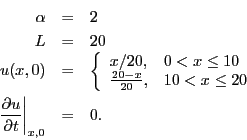
- Determine the solution to the wave equation where
Plot the solution for t=0 and several other times to clearly demonstrate the nature of the solution.
Extra credit: make a movie of the solution.
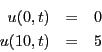
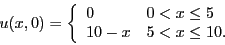
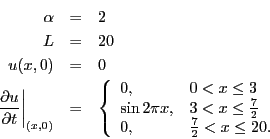
- Determine the solution to the wave equation where
- Determine the solution to
where
and
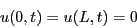
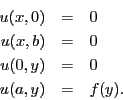
- By assuming u(x,y)=X(x)Y(y), determine the solution to
where
Plot an approximation to the solution by using the first few terms in the series representation of the solution.
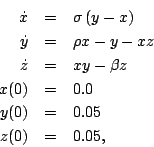
- Consider the famous Lorenz equations
where
- Use the second order Taylor series method to determine an approximate numerical solution to these equations for the time range t=0 to t=50. Submit a 3D plot of (x,y,z). Be sure to experiment with the time step to ensure that your solution is accurate. The Matlab plot3() function will probably be useful. A quick google search will probably give you an idea of what the plot should look like.
- Use Matlab's ode45() to compute an approximate solution and plot the result. Compare it with your plot from the first part of this problem.
What to plot
Posted: Wed Nov 21, 2007 12:26 am
by avalenzu
When you ask us to "Plot f(x) and the first several terms of the series on the same graph," which of the following (if either) do you mean?
A)
Plot 1: f(x)
Plot 2: term1 + term2 + term3 + term4
or
B)
Plot 1: f(x)
Plot 2: term1
Plot 3: term2
Plot 4: term3
Plot 5: term4
Re: What to plot
Posted: Wed Nov 21, 2007 3:33 pm
by goodwine
avalenzu wrote:When you ask us to "Plot f(x) and the first several terms of the series on the same graph," which of the following (if either) do you mean?
A)
Plot 1: f(x)
Plot 2: term1 + term2 + term3 + term4
or
B)
Plot 1: f(x)
Plot 2: term1
Plot 3: term2
Plot 4: term3
Plot 5: term4
I mean A). I want it as 1) a check on your answer to see that it is converging to f(x) and 2) as an exercise into the nature of how it is converging. If you plot the modes separately, it will be hard, if not impossible, to see how it's converging and what it's converging to.
Problem 7
Posted: Thu Nov 22, 2007 2:16 pm
by colinheye
Is the very first coefficient on problem 7 an 'a' or an alpha?
Re: Problem 7
Posted: Thu Nov 22, 2007 9:52 pm
by goodwine
colinheye wrote:Is the very first coefficient on problem 7 an 'a' or an alpha?
The very first coefficient is an "a". The coefficient of the "u" term by itself is an alpha.
#5 question
Posted: Sat Nov 24, 2007 1:35 am
by jsv2nd
#5 asks us to plot the solution at various values for t. I am confused about how to do this.
I solved the wave equation for u(x,0) correctly. I was able to use the equation for b_n, similar to the example in class. However, when t != 0, you now need to deal with a_n as well, which is associated with the sine term. This looks very messy, and I don't know how to treat it.
Is there a way to do this that I am not thinking of. Am I missing something from my notes?
Thanks
Problem 5
Posted: Sun Nov 25, 2007 3:20 pm
by colinheye
Do we need to plot the different u(x,t) plots as well as a movie? How do you want us to get the movie file to you?
Re: Problem 5
Posted: Sun Nov 25, 2007 8:15 pm
by goodwine
colinheye wrote:Do we need to plot the different u(x,t) plots as well as a movie? How do you want us to get the movie file to you?
You don't have to do a movie, but if you do it for extra credit, just email it to me. If it's too large to email, then put it in your www directory and send a link to me.
Re: Problem 5
Posted: Sun Nov 25, 2007 8:15 pm
by goodwine
colinheye wrote:Do we need to plot the different u(x,t) plots as well as a movie? How do you want us to get the movie file to you?
Just do it like I demonstrated in class on Wednesday.
Problem 7
Posted: Sun Nov 25, 2007 9:36 pm
by goodwine
You may assume the initial velocity for problem 7 is zero. Alternatively, you may work it out assuming it is an unspecified g(x).
Problem 8
Posted: Mon Nov 26, 2007 11:04 am
by goodwine
I did not provide a function for the boundary condition; thus, you can't plot anything. You may skip the plotting part of the problem.