Page 1 of 1
Homework 4, due February 20, 2008
Posted: Fri Feb 15, 2008 5:38 pm
by goodwine
- (50 points) Consider the string of masses connected by springs as is illustrated in the following figure.
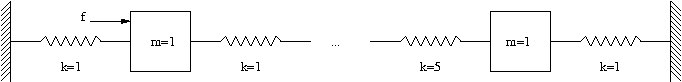
Assume there are 10 masses, all with a mass of 1. Assume that all the springs have a spring constant of 1 except for the second to last spring, between masses 9 and 10, which has a spring constant of 5. A force is applied to the first mass as illustrated.
- Determine the equations of motion for the system and write them as a system of first order inhomogeneous differential equations of the form
- Compute the eigenvalues and eigenvectors of the matrix A.
- Solve the differential equations in the case where
and
for t=0 to t=300. Explain any significant phenomena that you observe. You may assume that all the initial conditions are zero. Edit: present the results in a manner that clearly communicates the nature of the way the system behaves.
You may use a computer program to solve the equations if you wish. If you choose to do so, you may also use matlab and any built-in functions that may be useful.
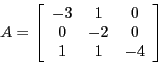
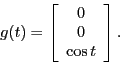
- (20 points) Solve
where
and
using the diagonalization method.
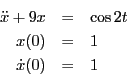
- (10 points) Solve
using Laplace transforms.
Problem 1 Part c
Posted: Mon Feb 18, 2008 9:46 pm
by colinheye
I have a matlab program that can get me through part b of the problem, but I am wondering what exactly you want from part c. Would a numerical methods approximation be appropriate as a solution, such as using euler method. This would entail 10 plots for each frequency corresponding to each mass position, so we would have 30 plots. If you are looking for symbolic solutions instead, is there a way in matlab to solve a symbolic diff eq? We tried 'dsolve' without success.
Re: Problem 1 Part c
Posted: Tue Feb 19, 2008 12:53 am
by goodwine
colinheye wrote:I have a matlab program that can get me through part b of the problem, but I am wondering what exactly you want from part c. Would a numerical methods approximation be appropriate as a solution, such as using euler method. This would entail 10 plots for each frequency corresponding to each mass position, so we would have 30 plots. If you are looking for symbolic solutions instead, is there a way in matlab to solve a symbolic diff eq? We tried 'dsolve' without success.
A numerical method such as Euler's method is fine. Some people I talked with tonight got it running pretty easily in Fortran. ODE45() in Matlab would be fine too. Whatever means you feel is the most effective manner to communicate the nature of the way the system responds is what I want. All the plots in one probably isn't best. 30 separate plots on different sheets of paper probably isn't best either.
problems 2 and 3
Posted: Tue Feb 19, 2008 9:53 pm
by msudyk
for the second two problems do we assume initial conditions are zero?
Re: problems 2 and 3
Posted: Tue Feb 19, 2008 9:55 pm
by goodwine
msudyk wrote:for the second two problems do we assume initial conditions are zero?
Yes for the second problem. For the third problem, the initial conditions are given.