Homework 8, due November 13, 2009.
Posted: Tue Nov 10, 2009 12:10 am
For each of the problems below, write a computer program in FORTRAN, C or C++ that determines an approximate numerical solution using the indicated method. Submit a plot of the solution(s) as well as a printout of your computer code. If two or more programs are nearly identical, it is permissible to submit one program and simply write on the code printout what the difference would be for another problem.
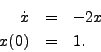
- Write a program that uses Euler's method with a time step of dt=0.1 to determine an approximate numerical solution to
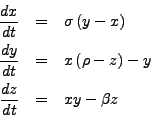
- Write a computer program that uses 4th order Runge-Kutta to determine an approximate numerical solution to
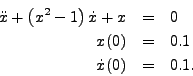
Repeat the problem with - Write a computer program using 4th order Runge-Kutta to determine an approximate numerical solution to
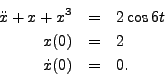
- Write a computer program using 4th order Runge-Kutta to determine an approximate numerical solution to